

Wordcloud created from all the words in the wikipedia page for “mathematics education”
What does a teacher need to know to intelligently integrate technology in their teaching? Or better still, what is it that teachers need to know to become effective teachers?
So this morning I was playing around with a wordcloud generator. Throwing in words from our notes from the Scottsdale Design day… and I got to thinking about how it could be used as an educational tool, specifically to teach mathematics.
Now, I know what you are thinking, Wordle’s are so passe´, so yesterday. Everybody (and their uncle) uses them and it’s not clear (at least to me) most of the time what value it is bringing into teaching. So bear with me and let me see if I can explain (a) how it can be used to teach mathematics, or at least some content in mathematics; and (b) what implications it has for teacher education and teacher professional development.
I know there are many wordcloud generation sites out there, but the one I focus on is one created by Jason Davis, and is at https://www.jasondavies.com/wordcloud/
So, this morning, I uploaded our notes from the design day into it – and made a Wordle. Actually I made 3. Here they are:
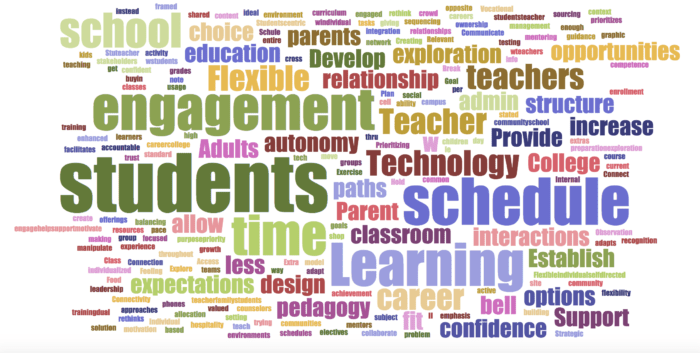
(Wordle 1)
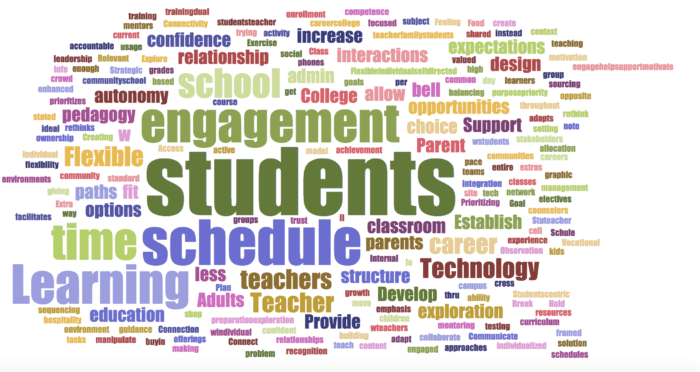
(Wordle 2)
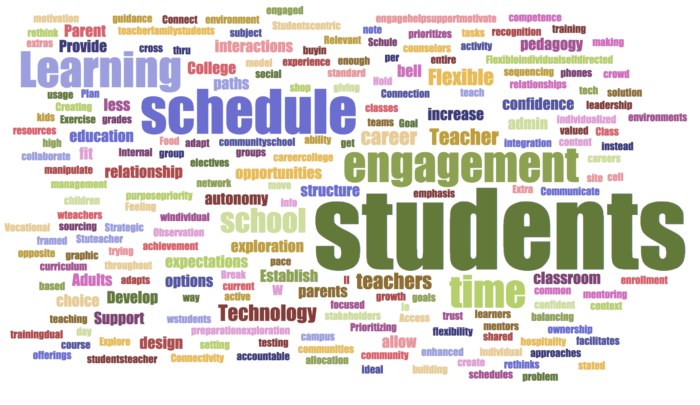
(Wordle 3)
Now even though these may look similar, there are important differences, and not just in the placement of the words. The key difference is in relative sizes of the words in the Wordle. For instance, see the relationship between “students” and the word “flexible” in each of them. The word “students” gets larger from Wordle 1 to 3 while “flexible” becomes smaller? Why is that?
Turns out it all depends on a set of choices given by Jason, more specifically as follows:
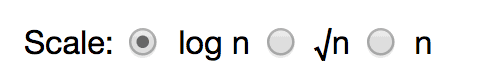
Depending on whether you choose log n, sqrt n or n you get different designs. Why the heck is that and why do we care?
So I jumped onto Google and got the graphs for the three functions. You don’t even need a special graphing calculator or software. Google just gives it to you. Here are the graphs:
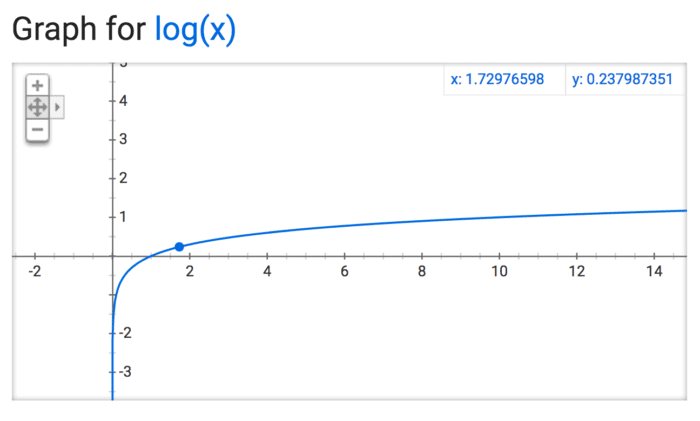
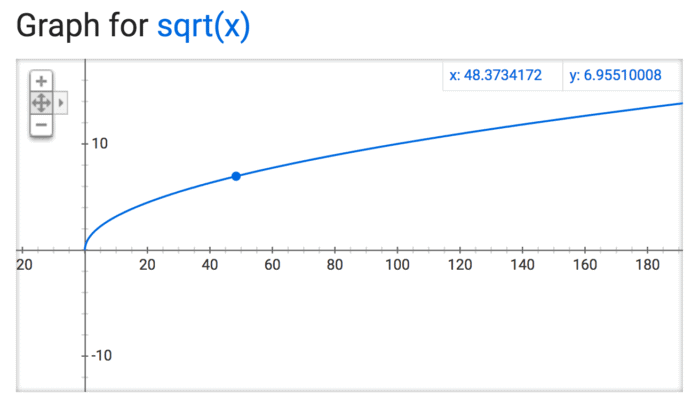
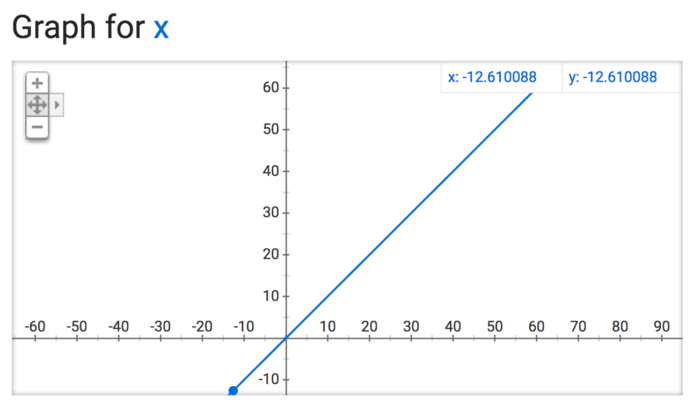
As you will see above – the main difference between these three graphs (for logx, sqrtx and x) is how the lines grow and flatten out (or not) loosely speaking. The steeper the line the greater the contrast between the larger and smaller words. In other words as we move from, n to sqrt n and log n the manner in which the words are weighted changes – based on a mathematical formula. The graph for x is linear, while those for logx and sqrtx, are non-linear (i.e. not a straight line). In addition the graphs for logx and sqrtx differ in how they slope as we move away from 0. The graph for logx flattens out faster than the graph for sqrtx. That is just a property of these functions.
Now imagine if I were to determine the size of words that go in the wordle based on each of the equations. So we let the number of times a word occurs in a text along the x axis. In the case of the the linear graph (y=x) the more times a word pops up the larger its y value would be. However, for the same value of x the the point on the y axis for the other two would be different. So in the case of y=x, the difference between the most used word and the least use word would be huge, less so in the case of sqrtx – since it flattens out relatively slowly, compared at least to logx which flattens out the fastest. So here we have a great visual representation of the manner in which these 3 functions behave.
Now imagine a lesson plan that teaches students about such graphs using Wordles. How cool is that, what a wonderful way to show the presence of mathematics in, what is effectively, word counting. Thus an abstract idea of growth and ratios and equations that is mapped out in a relatively concrete manner in a wordcloud.
Now imagine a teacher who can “see” this opportunity, is willing to play and then create a lesson plan.
The point here not about wordclouds – but rather about how we see the world, in this case through a mathematical lens.
Other disciplines will provide different opportunities.
Which brings me to my main point.
That’s the teacher we want to create. That’s about creativity, flexibility, deep knowledge of content and a willingness to play. It is about being opportunistic and always being ready.
The question then becomes – what do WE, as teacher educators and faculty members in a college of teacher education, need to do to create this kind of a teacher? That is our challenge.
In fact, I would argue that this challenge goes beyond technology integration. It is really about helping develop a mindset that is always curious, always seeking new ways to think about content and presenting it to our students.
It is a challenge worthy of effort, and if we won’t do it, who will?


Punya,
This post highlights an amazing insight into the presence of math in “word graphing.” Thank you for sharing!
On a different note, when I taught high school, I changed the method in which my students and I went over our course syllabus. “Going over the syllabus” on day one always seemed incredibly boring, and obviously, my students never seemed highly interested. That is so wrong for our first day of class!
So, I put our syllabus into Wordle, and students spent time analyzing the word cloud, making inferences, and determining meaning. They then shared with me, and their classmates, what they thought the class was going to involve, as well as the overall themes to our course. Flipping this entire process made it more engaging and student centered.
Here is a link to they syllabus: https://www.scribd.com/document/338562496/Zoology-Syllabus-Copy
Here is a link to the word cloud: https://www.scribd.com/document/338562614/Zoology-Syllabus-Cloud1
Thanks again for sharing!
Erin, what a cool idea, with the syllabus. I think I am going to try it with a master/doctoral seminar I plan on teaching this summer. It really allows you to criss-cross the landscape of the course and it provides a bird’s eye view of the ideas. The question of course is which scale we should choose (n, sqrt(n) or log(n)). Each of them will provide a different sense of “scale” and prominence of the ideas relative to each other. Another nice pedagogical dilemma. As I have said before, in another context, I prefer the word dilemma to problem, because problems have solutions, while dilemmas have resolutions (implying compromise and judgement).